

In October–December 2024, UK online gambling recorded 25.9 billion bets and spins, an 8% year-over-year increase, while average monthly active accounts rose 3%, according to the UK Gambling Commission's operator dataset. That combination captures the central challenge of gaming data analytics: operators need to understand activity, revenue, and player protection together, not treat each as a separate reporting problem.
Table of Contents
- Why Gaming Data Analytics Now Runs the Business
- Where Casino and Sportsbook Data Comes From
- Core KPIs Behind Yield and Risk
- Four Methods from Description to Action
- Use Cases for Casinos and Sportsbooks
- How to Choose a Stack and Govern It
- A Practical Next Step for Analytics Teams
Why Gaming Data Analytics Now Runs the Business
The UK Gambling Commission has collected online gambling data from the largest operators since March 2020. In the October–December 2024 quarter, online gross gambling yield reached £1.54 billion, up 21% year over year. The same dataset recorded the growth in bets and spins noted above, while average monthly active accounts rose at a slower pace. These measures describe different parts of a live business: financial yield, activity, and the number of active accounts.
That distinction matters. Revenue can rise while customer counts barely change, which may indicate a change in activity per account, product mix, or monetization. The figures don't establish the cause by themselves. They show why operators need to investigate financial and behavioral indicators in context instead of treating any one movement as a complete performance story.
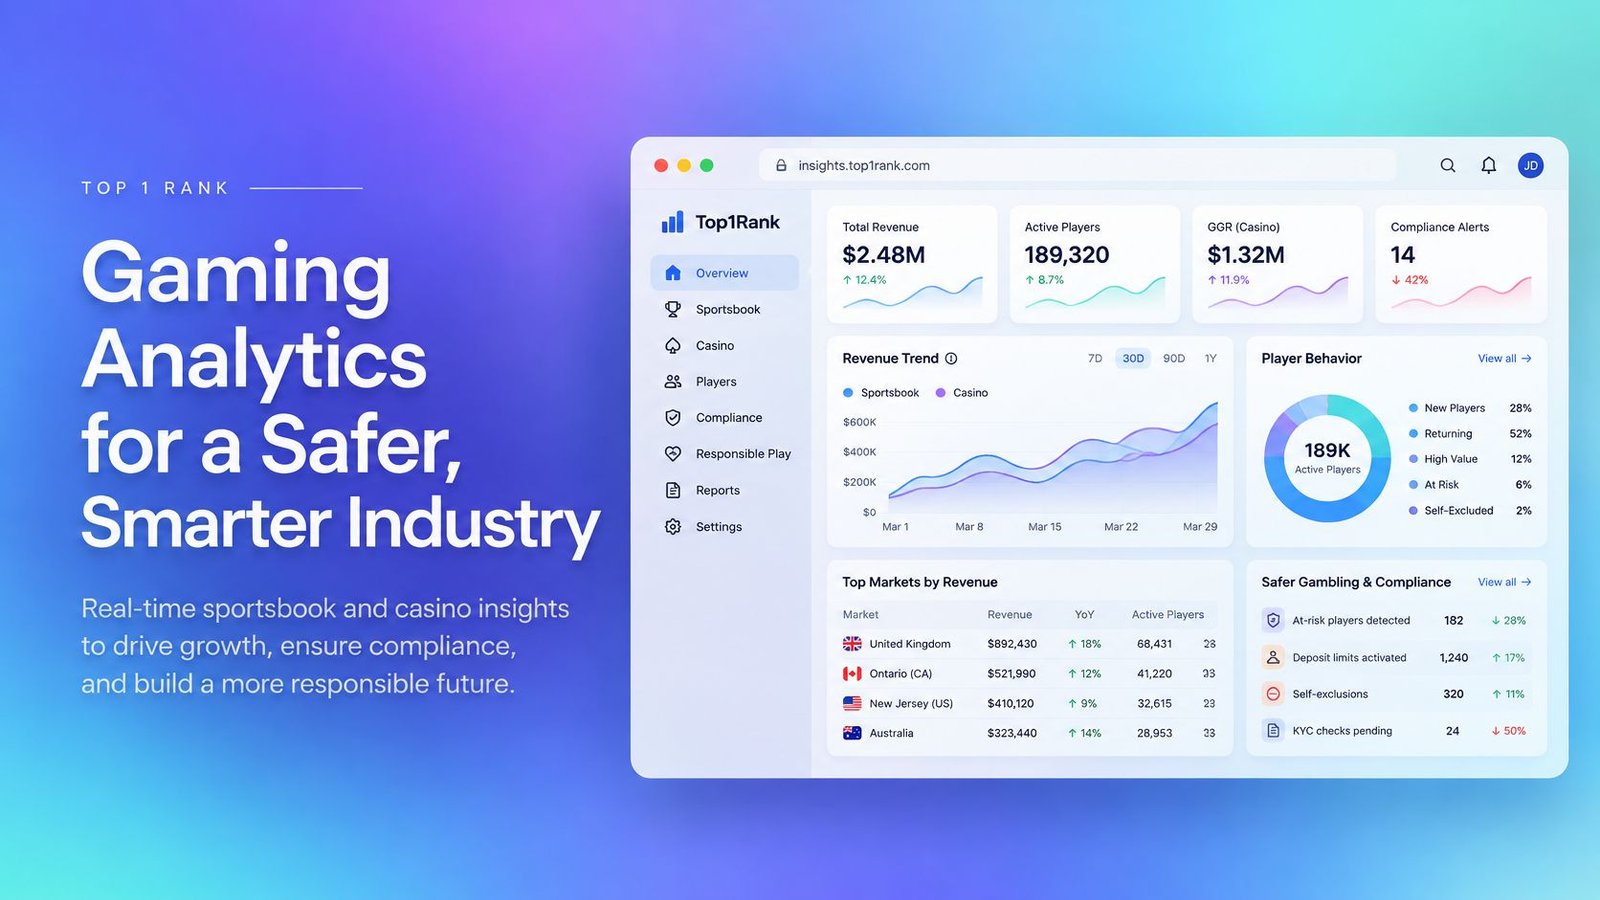
One system, several decision-makers
Online casino and sportsbook operators use analytics to monitor product performance, customer activity, and safer-gambling signals. Suppliers need reliable evidence about how products perform across operators and markets. Affiliates and investors look for context that helps them interpret commercial movement, while regulators use reporting and behavioral indicators to monitor licensed activity.
A one-time survey can describe a moment or explore consumer behavior, but it can't replace recurring operational data for monitoring a changing business. The operator dataset provides a repeated baseline; surveys add context about people, devices, and choices that transaction records alone may not reveal. Together, they help distinguish a change in participation from a change in how active users engage.
For leadership, this makes analytics a management and compliance control system, not just a marketing dashboard. That has implications for reporting processes and oversight, including the changing regulatory environment operators track through updates on PAGCOR regulatory requirements. The useful question isn't only whether a metric moved. It's whether the movement has a defined business meaning, a responsible owner, and a clear relationship to player-protection outcomes.
Where Casino and Sportsbook Data Comes From
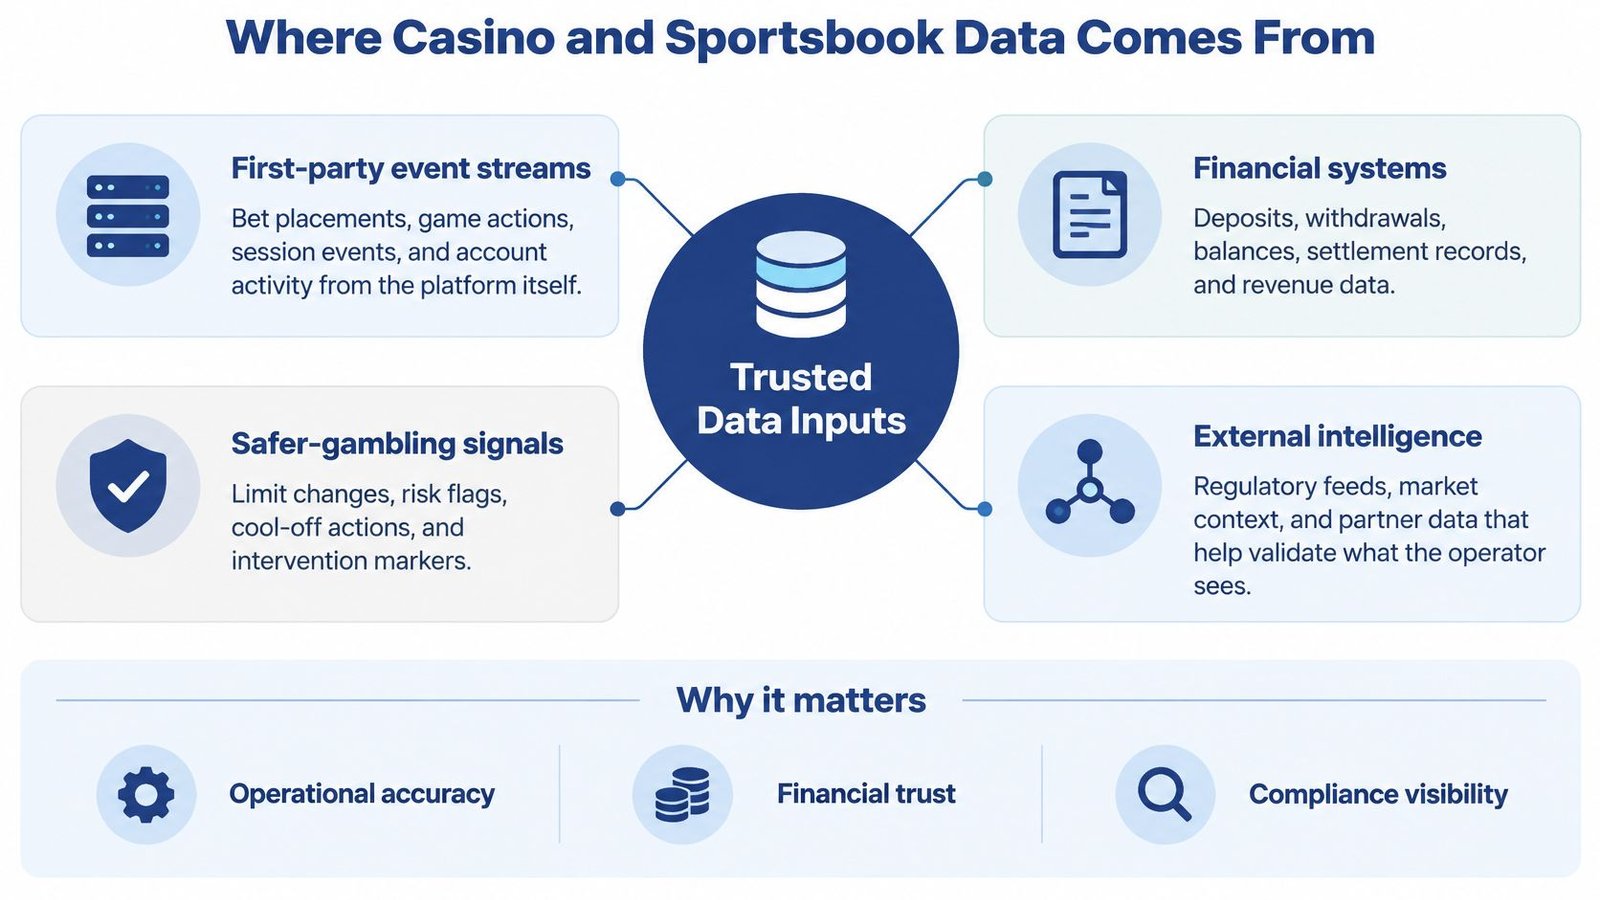
An operator's source map starts with what the business directly records, then adds evidence that can explain or validate those records. No single feed proves everything. Event logs can show what happened on a platform, for example, but can't by themselves establish a person's full behavior across other brands.
Match the source to the question
First-party event streams record activity such as bets, game actions, account events, and sessions. They're useful for understanding what occurred within an operator's own products. Account and payment records add information about deposits, withdrawals, balances, and settlements, helping finance and compliance teams reconcile activity. Session and device logs can help product teams assess how people access a service, while safer-gambling markers record signals such as limit changes, risk flags, and interventions.
Regulatory returns provide a different view. They organize financial activity and operational events for a licensed activity, but they aren't designed to answer every product or customer-behavior question. Consumer surveys, meanwhile, can explore behavior beyond an operator's own platform, though they rely on respondents' reports rather than a continuous transaction record.
The UK Gambling Commission's survey of approximately 8,000 adults across March, June, September, and December 2020 found that 24% had gambled online in the previous four weeks, compared with approximately 17% five years earlier. Roughly 4,000 recent online gamblers provided detailed information about devices, locations, accounts, in-play betting, and esports betting. The Commission reported that mobile phones were the dominant access device, particularly among younger users; online gamblers held an average of three accounts, with younger gamblers often holding more; and one in five had gambled outside the home. These findings come from the Commission's in-depth online gambling survey.
Read participation beyond the transaction
For operators, these dimensions can shape acquisition analysis, mobile product decisions, and compliance monitoring. Multi-account behavior complicates customer-level interpretation, while location and product type can add context to an activity pattern. A survey offers a broader behavioral perspective, but it doesn't replace platform records. Conversely, platform data can't reliably show the full activity of a person who uses multiple operators.
Payment and identity processes also affect what teams can observe and reconcile. For operators evaluating how these systems intersect with compliance, PAGCOR payment gateway accreditation is a relevant regulatory topic. The practical test is simple: identify what each source can prove, where its coverage ends, and which decision it can responsibly support. Analytics limited to stakes and revenue risks misreading participation because it leaves device, account, location, and product context out of view.
Core KPIs Behind Yield and Risk
A KPI is useful only when its definition is stable enough for the decision it supports. Operators may track stakes, prizes, yield, active accounts, bets or spins, sessions, session length, and contribution by product or geography. But those measures don't answer the same question, and a financial figure isn't comparable across reports unless the underlying revenue definition is clear.
GGY and GGR aren't interchangeable
For UK regulatory returns, licensed operators must report Gross Gambling Yield (GGY), not Gross Gambling Revenue (GGR). The Gambling Commission says reported stakes and prizes must include only transactions forming part of the GGY calculation, and operators are responsible for ensuring that submitted figures use the required basis in its regulatory returns guidance.
A terminology error can flow through finance reconciliation, regulatory submissions, and comparisons between markets. If a team can't document what is included in a revenue field, it can't safely assume that two dashboards or filings are comparable.
The Commission's October–December 2024 slots data shows why financial measures need behavioral context. Slots generated £709 million in GGY, up 15%, from 23.9 billion spins, up 9%. The product recorded 4.4 million average monthly active accounts, up 10%, and 170 million sessions, with 6% lasting longer than one hour. Spins per session moved from 145 to 151, while GGY per session changed from £4.10 to £4.13. These figures are part of the same operator dataset cited earlier, not a separate performance benchmark.
| Metric | Question it answers | Failure if used alone |
|---|---|---|
| GGY | What yield is reported under the applicable definition? | An unclear or inconsistent basis undermines reconciliation and comparison. |
| Active accounts | How many accounts were active under the chosen definition? | Account counts don't reveal intensity or activity across multiple accounts. |
| Bets or spins | How much recorded product activity occurred? | Activity volume doesn't establish yield or player protection. |
| Session length | How long did recorded sessions last? | Duration alone doesn't explain the player's broader pattern or outcome. |
| Product or geographic contribution | Where did reported performance arise? | Aggregated totals can conceal important differences between categories or places. |
Nevada provides a land-based definition lesson, not an online benchmark. Its FY2025 statewide gaming win was $15,639,653,228, split between slot machines and table, counter, and card games. Its reporting also distinguishes county contribution. The value of such figures depends on consistent definitions for category, geography, and gaming win.
A sound KPI therefore needs a documented definition, a product or market scope, and a decision owner. Acquisition teams, for example, should connect the metric to a clear cost basis rather than comparing unaligned totals; that distinction is relevant when assessing user acquisition cost.
Four Methods from Description to Action
Analytics moves from reporting toward decisions in stages. The sequence matters because a forecast can look precise while answering the wrong question, and an automated recommendation can be deployed without proving that it helped.
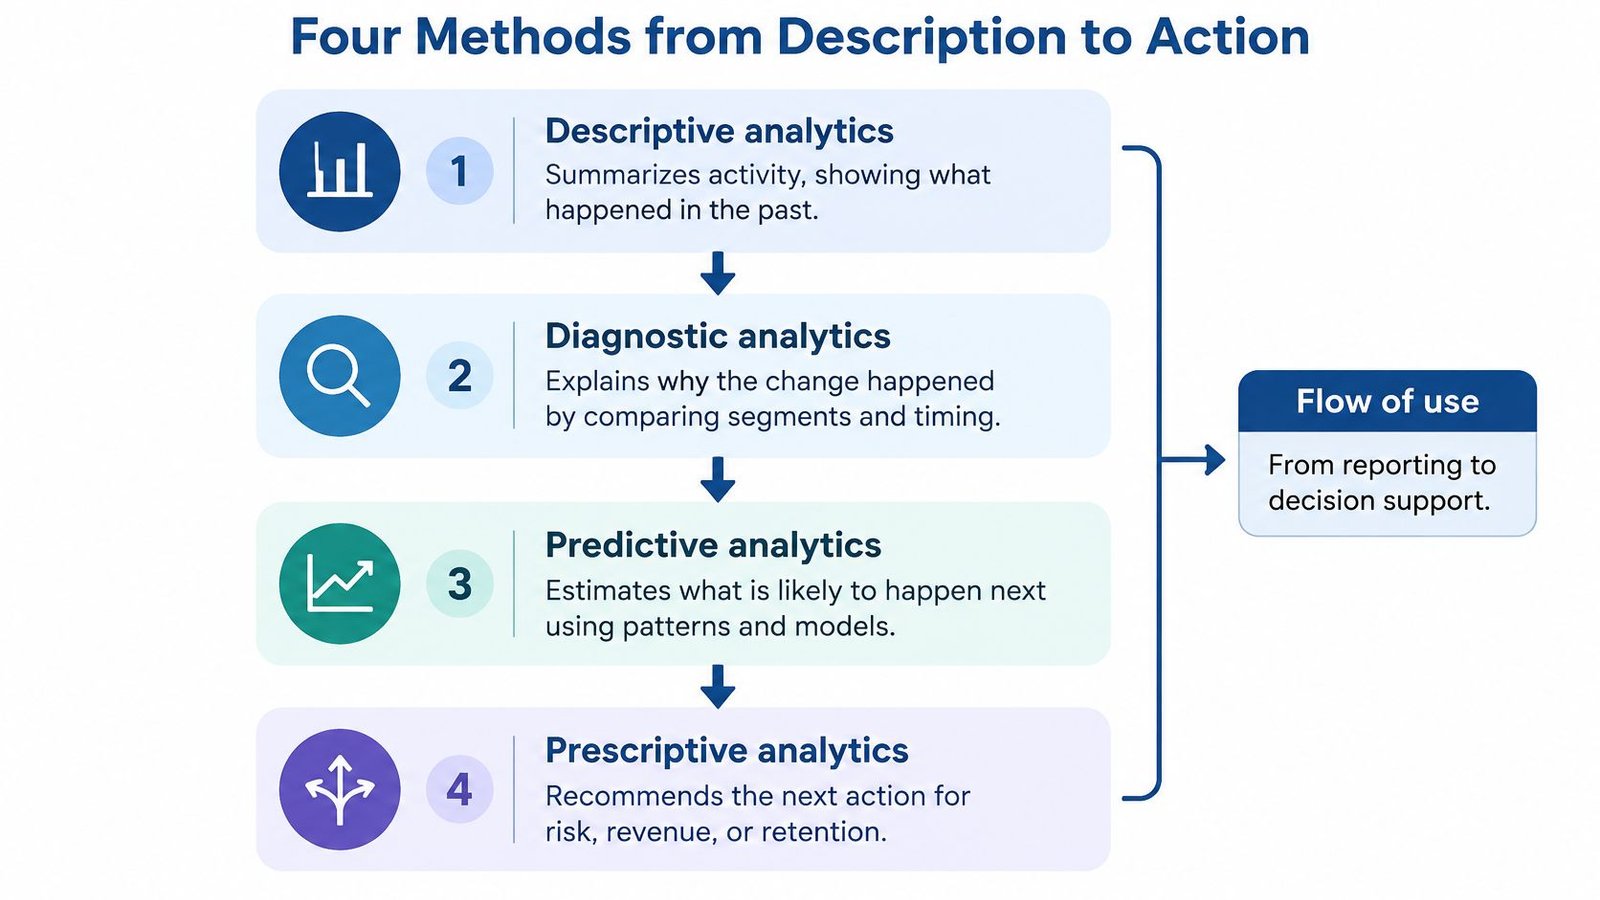
Descriptive analytics summarizes activity, yield, accounts, and sessions against a stable baseline. Diagnostic analytics investigates why a change occurred, testing whether product mix, device, promotion, or session length helps explain it. These stages establish the evidence before a model or intervention is asked to do more.
Predictive analytics estimates what may happen next, such as churn, bonus abuse, or higher-risk play. It should begin with a defined outcome, not with a model's available output. Prescriptive analytics recommends a response, then evaluates whether the intervention changed the intended protection or commercial outcome.
Test the model, not just its score
The evidence base warrants restraint. A 2025 scoping review found only 16 eligible studies on AI risks and ethics in gambling, with recurring gaps in explainability, algorithmic flaws, accountability, consumer rights, and human oversight. Regulatory research calls for standardized reporting, reproducible data or code, and transparent evaluation frameworks for commercial harm-detection tools in the scoping review of AI risks and ethics in gambling.
A model can generate false positives that trigger unnecessary contact or false negatives that miss a relevant signal. Subgroup bias can make performance uneven, while drift can undermine a model as behavior or products change. Human review gives operators a way to examine context before acting, but it doesn't replace outcome evaluation.
Operational test: Compare predictive performance with what happened after intervention. A risk score identifies activity; it doesn't establish that player harm was reduced.
More complexity doesn't automatically mean greater safety. Opaque personalization could increase persistence or alter stake size and frequency, while the evidence for net consumer benefit remains immature. Operators should require transparent evaluation and human oversight, then judge a model by the protection outcomes it supports, not by a vendor ranking or technical sophistication alone.
Use Cases for Casinos and Sportsbooks
A casino retention team may see an account becoming less active and consider a targeted offer. Before acting, it needs to distinguish inactivity from a person shifting activity to another account, and define what evidence would show the intervention worked. The decision owner is the retention lead; confirmation should include the intended engagement measure alongside a check that the action didn't create an unwanted risk outcome.
Player segmentation also needs more than value tiers. Product, device, account count, and age-related behavior can change how a segment should be understood. The Commission's survey findings described earlier make mobile access and multiple accounts relevant analytical dimensions, particularly when teams assess acquisition or monitoring. The decision owner might be a product or CRM lead, but the segment should be retained only if it supports a clear decision and can be evaluated against player outcomes.
Pair commercial measures with behavior
Yield optimization is a case where one number can mislead. In the Commission's 2024 slots data, GGY per session moved only from £4.10 to £4.13, while spins per session rose from 145 to 151. An operator shouldn't read the yield movement alone as evidence of healthier or more valuable engagement. The decision owner is the casino product or commercial lead; the test needs to consider both the financial result and the behavioral pattern.
Sportsbook activity calls for a different lens. In-play and esports participation aren't the same behavior as casino session length, and a person may show different patterns across products. For fraud or bonus-abuse investigations, operational events and payment patterns can be more informative than an unexplained anomaly score. Compliance or payments teams should be able to point to the events that support a flag and explain what would clear it.
For land-based and omnichannel groups, geography and category also need to remain visible. Nevada's FY2025 figures recorded $10,611,179,371 in slot-machine gaming win out of $15,639,653,228 statewide, while Clark County accounted for 86.8% of statewide win, according to the Nevada Gaming Control Board's FY2025 information sheet. Those figures illustrate why category and location matter within that market; they're not an online comparison.
For analysts building repeatable pipelines, methods used in other data-intensive fields can provide useful technical perspective. Faberwork LLC's resource on logistics data analysis with Python offers adjacent context on using code to analyze operational data, without substituting for gambling-specific governance. Operators assessing platform requirements can also consult PAGCOR game aggregator accreditation requirements as part of their regulatory research.
How to Choose a Stack and Govern It
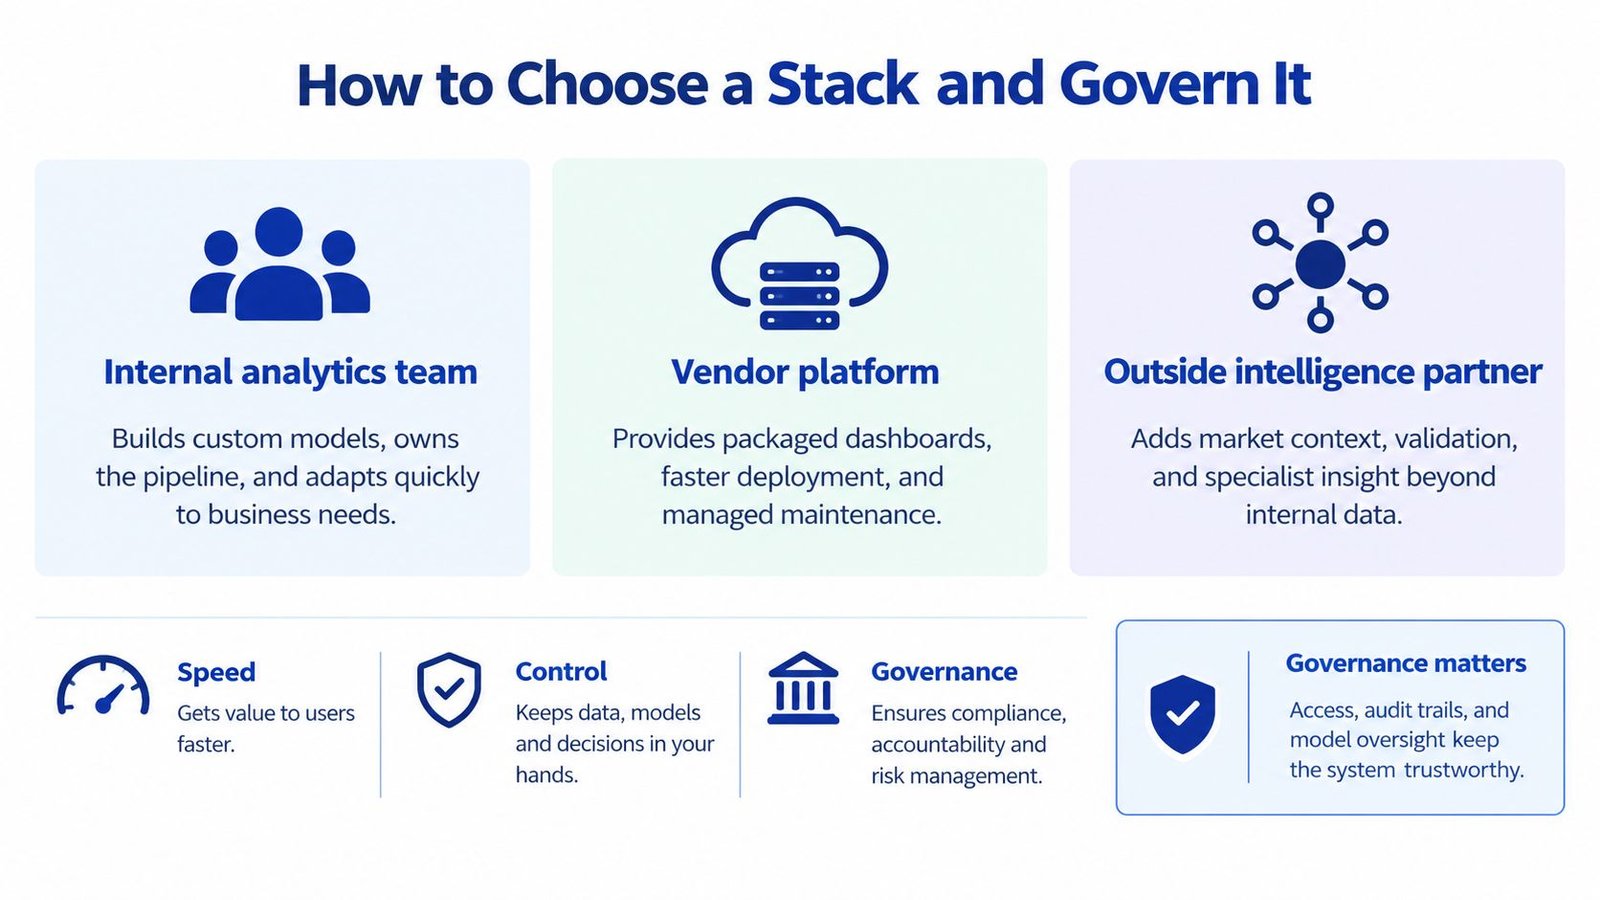
An analytics stack should fit the decisions it must support, not just the largest volume of data the business can collect. Three approaches contribute different things: an internal platform gives an operator control over its own data; regulatory returns supply a defined reporting obligation; and external intelligence provides market context that internal records can't supply.
Choose the minimum useful architecture
An internal route typically needs event collection, identity resolution, a warehouse with shared definitions, and tools for business intelligence, modeling, and case review. A vendor platform may provide packaged dashboards and managed maintenance, but operators still need to validate its definitions, access controls, and fit with their reporting obligations. Neither approach removes the need for clear ownership of data and decisions.
Regulatory reporting is a required output, not a substitute for a complete internal analytics environment. The UK Gambling Commission requires a return for every licensed activity within 28 days of quarter-end. A quarter ending 31 March, for example, is due by 28 April. Returns include financial activity and operational events, so teams must consolidate information across products and licences in time to review the submission. The Commission's summary of regulatory data sources describes the framework.
External intelligence helps teams assess whether an internal movement may be local to a business or part of a wider market shift. Top 1 Rank covers global regulation, operator and market developments, sports betting, online and live casino, suppliers, and research. For organizations considering how to unify internal information, unified data platforms for enterprise analytics provides additional context on the platform question, though no vendor or architecture can settle an operator's governance requirements for it.
Cross-operator signals raise a separate trade-off. UK online GGY reached £1.42 billion in July–September 2025, up 8% year over year, while bets and spins rose 3% to 26.1 billion. Regulatory research sees potential value in cross-operator data for financial-risk identification, but flags privacy, consent, and regulatory barriers in its research on AI and player-risk identification and response.
Federated analysis can support shared insights without automatically pooling raw records. Purpose limitation, retention rules, player notification, and independent audits should be explicit design choices. Operators should define what data is necessary for a legitimate intervention and what should remain isolated; more data is not automatically better governance. Requirements tied to PAGCOR gaming system administrator rules can also inform jurisdiction-specific compliance review.
A Practical Next Step for Analytics Teams
A useful quarterly exercise doesn't require rebuilding the entire analytics stack. It requires one product, one clearly defined financial measure, one behavioral marker, and one player-protection outcome that can be reviewed together.
Start by choosing a product and confirming the revenue field matches the legal yield definition for its licence. Pair that field with a behavioral indicator relevant to the product, then document the protection outcome the team expects an intervention to affect. If the metric, behavior, and outcome use different definitions or scopes, the review should resolve that mismatch before the result reaches leadership.
Set the review calendar against the reporting obligation. For UK licensed activity, the return is due within 28 days of quarter-end, so the internal analysis should be complete early enough for finance and compliance to resolve discrepancies before submission. The point is to catch definition problems before they become filing disputes, not to add a second reporting exercise after the deadline approaches.
Any automated risk flag should receive human review. The team should record what would count as success, what would count as harm, and which evidence would cause it to stop or revise the intervention. This makes a model's role testable without treating its output as a final judgment.
For external context, operators, suppliers, investors, and regulators can use Top 1 Rank's global iGaming intelligence coverage to compare internal movements with regulatory and market developments. The decision standard for the next quarter is straightforward: retain a metric, intervention, or data share only when finance, compliance, and product teams can explain it using the same definition. Start with one product and establish that shared review before expanding the system.
For ongoing regulatory and market intelligence, follow Top 1 Rank's coverage of global iGaming developments and apply the same standard to every analytics decision: a clear definition, an accountable owner, and evidence that connects commercial performance with player protection.





Join thousands of gaming professionals receiving the latest iGaming news, regulatory updates, and market insights.
