


Global casino industry coverage in 2026 is being shaped by three measurable shifts, UK remote casino now accounts for roughly 42.9% of UK gambling GGY, Nevada posted $15.80 billion in statewide commercial gaming revenue in 2025, and the UK has live age-based online slots stake limits as low as £2 for players under 25. Those numbers do more than fill headlines, they show where the money is moving, where regulation is getting more granular, and why segment math matters more than ever.
Casino industry news now has to be read like a filing, not a headline reel. The strongest stories are no longer just about openings, closures, or quarterly beats, they're about revenue mix, product-level regulation, and the difference between what a market says on the surface and how it earns underneath.
Table of Contents
- Why Casino Industry News Matters in 2026
- The Building Blocks of Casino Industry Reporting
- Land-Based Casino Revenue Across Major Jurisdictions
- Online Casino Growth and Operator Performance
- Regulation, Safer Gambling, and the Open Questions
- Reporting Gaps Worth Watching Through 2026
- How to Read Casino Industry News Going Forward
Why Casino Industry News Matters in 2026
Nevada remains a useful benchmark for casino industry news because the state's regulator publishes ongoing revenue data across major commercial gaming segments. In 2025, the market set a new record at $15.80 billion, its fifth straight year of annual growth, even though the Strip and the mix beneath it did not move in lockstep (Nevada Gaming Control Board 2025 press release).
That mix matters. Electronic gaming devices generated $10.71 billion, table-game revenue fell to $4.45 billion, and sports betting climbed to $601.4 million. The usable story names the product line, the venue type, and the operating model. A market can expand while its components move in different directions, and that is the point readers should test against the filing.
Who watches this market
Operators watch these releases for pricing power, traffic, and mix. Regulators watch them for tax yield and compliance pressure. Investors watch them for concentration risk, especially where a small number of properties drive a large share of the total.
A single regulator update can matter more than a wave of marketing claims. A licensing rule, a stake cap, or a segment shift can change product economics faster than a brand campaign can offset it. For operators with regional exposure, the question is whether the latest casino industry news signals a durable change in demand or a temporary change in mix. A useful starting point for tracking those shifts is the latest PAGCOR regulatory updates overview.
Practical rule: if a story does not name the segment, the jurisdiction, and the reporting period, it is not yet a usable market signal.
The Building Blocks of Casino Industry Reporting
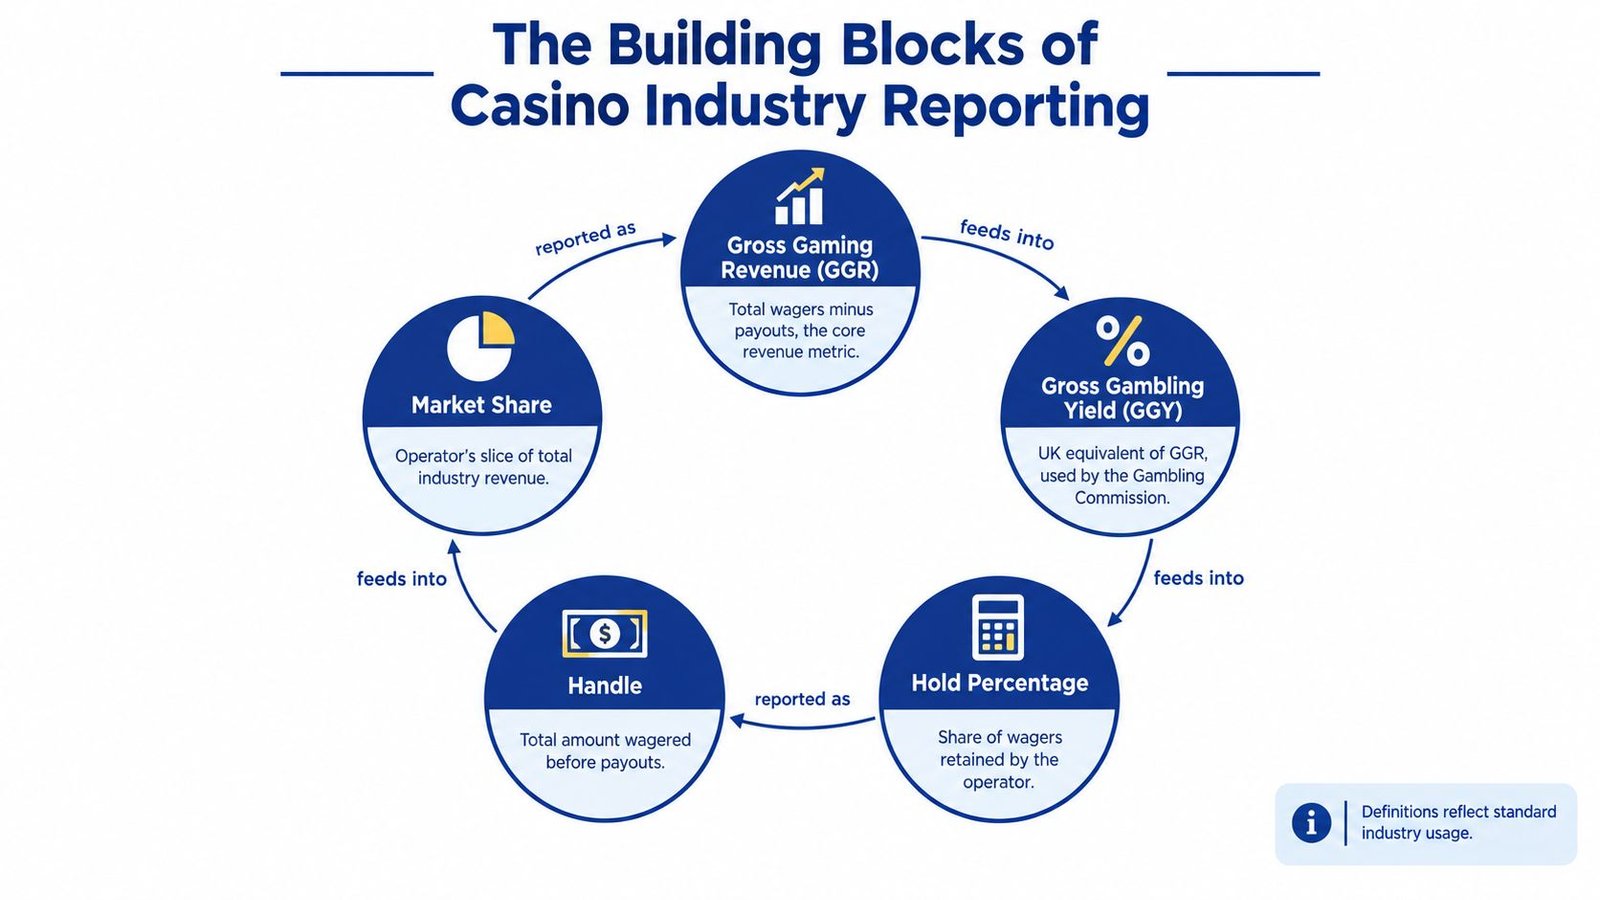
Casino reporting relies on a small group of terms that look alike but measure different things. GGR, or gross gaming revenue, is the core land-based revenue figure. GGY, gross gambling yield, is the UK's preferred equivalent. Handle is the amount wagered before payouts, while win is what the operator keeps after payouts. Hold percentage shows how much of handle an operator retains.
The distinction is practical, not semantic. Boyd Gaming said its 2025 gaming revenue rose by $54.2 million, while the same filing showed slot handle increased 2.8% and slot win increased 2.5% (Boyd Gaming 2025 Annual Report and 10-K). Handle and win point in different directions, and that gap helps readers judge whether demand is broadening or whether hold is doing more of the work.
Read the numbers in the right frame
Remote and land-based markets also use different yardsticks. The UK reports GGY, not GGR, because the metric measures what operators retain after winnings, before costs. The Gambling Commission's annual stats put total UK industry GGY at £17.5 billion for the year to March 2026, with remote casino contributing £5.7 billion. That makes the online segment a material part of the read, not a side note (Gambling Commission industry statistics 2026).
Market share is another filter. A property can post respectable revenue and still lose share if rivals grow faster. A jurisdiction can post a record and still show weakness in one vertical.
Acquisition economics also change how handle growth should be read, especially where promotional spend rises faster than retained revenue. A closer look at user acquisition cost in regulated gambling markets helps explain why topline growth does not always translate into cleaner operator performance.
Separate revenue, vertical mix, regulation, and technology adoption before drawing a conclusion.
A single figure rarely explains a casino business. The useful question is what that figure leaves out.
Land-Based Casino Revenue Across Major Jurisdictions
Nevada, Detroit, and Massachusetts each show a different way to read land-based casino news. The useful question is what moved, what stayed flat, and which segment carried the total.
Nevada sets the benchmark
Nevada's 2025 statewide commercial gaming revenue reached $15.80 billion, while the Strip generated $8.82 billion, flat against the prior year. That mix matters because the state's headline result did not depend on one runaway segment. Table-game revenue fell 3.3% to $4.45 billion, while sports betting rose 24.7% to $601.4 million. The overall market can still advance when product mix shifts, even with weak verticals.
Monthly prints need caution
Detroit is a cleaner warning against overreading one month. Its three commercial casinos produced $103.55 million in aggregate revenue in September 2026, with table games and slots making up $102.78 million and retail sports betting adding only $769,771 in qualified adjusted gross receipts from a $12.39 million handle. That leaves casino gaming at about 99.3% of the month's combined revenue. The monthly drop from August matters, but so does the year-on-year gain through September. One reporting period should never be treated as a full operating thesis.
Massachusetts shows a different point, concentration. Statewide licensees generated $1.192 billion in gross gaming revenue in fiscal year 2025 and contributed $340.63 million to the Commonwealth. Encore Boston Harbor accounted for $740.69 million of GGR, while MGM Springfield contributed $277.1 million. Those two properties alone produced more than $1.017 billion in reported GGR, which shows how concentrated regulated casino output can be. The same pattern helps explain why readers should separate flagship performance from the rest of the licensed base, a split that also matters in markets such as Casino Filipino Angeles coverage.
| Jurisdiction | Latest Reported Period | Revenue Reported | Key Segment Note |
|---|---|---|---|
| Nevada | 2025 full year | $15.80 billion | Table-game revenue fell while sports betting grew sharply |
| Detroit | September 2026 | $103.55 million | Slots and table games accounted for almost all monthly revenue, retail sportsbook was a small add-on |
| Massachusetts | Fiscal year 2025 | $1.192 billion | Two named casinos generated more than $1.017 billion of that total |
For regional market coverage, the right frame is always the same, what moved, what did not, and who captured the revenue. A headline about “record casino revenue” only becomes useful after the segment split is clear.
Online Casino Growth and Operator Performance
Digital casino reporting runs on a different clock, and the split matters. In the UK, remote casino generated £5.7 billion in GGY in the year to March 2026, up £736 million year over year, and it accounted for about 42.9% of total UK gambling GGY (Gambling Commission industry statistics 2026). That makes online casino the clearest growth engine in a mature regulated market, but the headline only makes sense once the segment mix is visible.
Segment mix tells the real story
Boyd Gaming is useful because its filing separates core casino performance from partner economics. The company reported total revenue up $161.8 million, or 4.1%, in 2025, gaming revenue up $54.2 million, and a $125.7 million increase in online reimbursements revenue tied to taxes and other expenses paid on behalf of online partners (Boyd Gaming 2025 Annual Report and 10-K). That mix matters because online reimbursements are not the same thing as traditional casino win.
NagaCorp shows a different structure. Its 2025 gross gaming revenue reached US$691.6 million, with mass-market GGR at US$485.0 million and VIP GGR at US$206.6 million (NagaCorp annual report 2025). Mass-market play represented roughly 70% of total reported GGR, while VIP growth was faster year over year. The comparison with Boyd is useful because one operator is reading a hybrid land-based and partner model, while the other is balancing mass and VIP in an integrated resort setup.
Analytical rule: total revenue can rise for very different reasons, so segment mix has to be checked before margin, risk, or scalability are discussed.
For readers comparing operator economics, our guide to an online casino with good payouts shows how payout structure shapes player retention. The right question is where revenue is compounding, where hold is changing, and how much of the mix is exposed to higher-frequency digital activity. Remote growth remains real, but it should be read on its own terms, with licensed digital activity kept separate from other casino lines and from offshore substitution.
Regulation, Safer Gambling, and the Open Questions
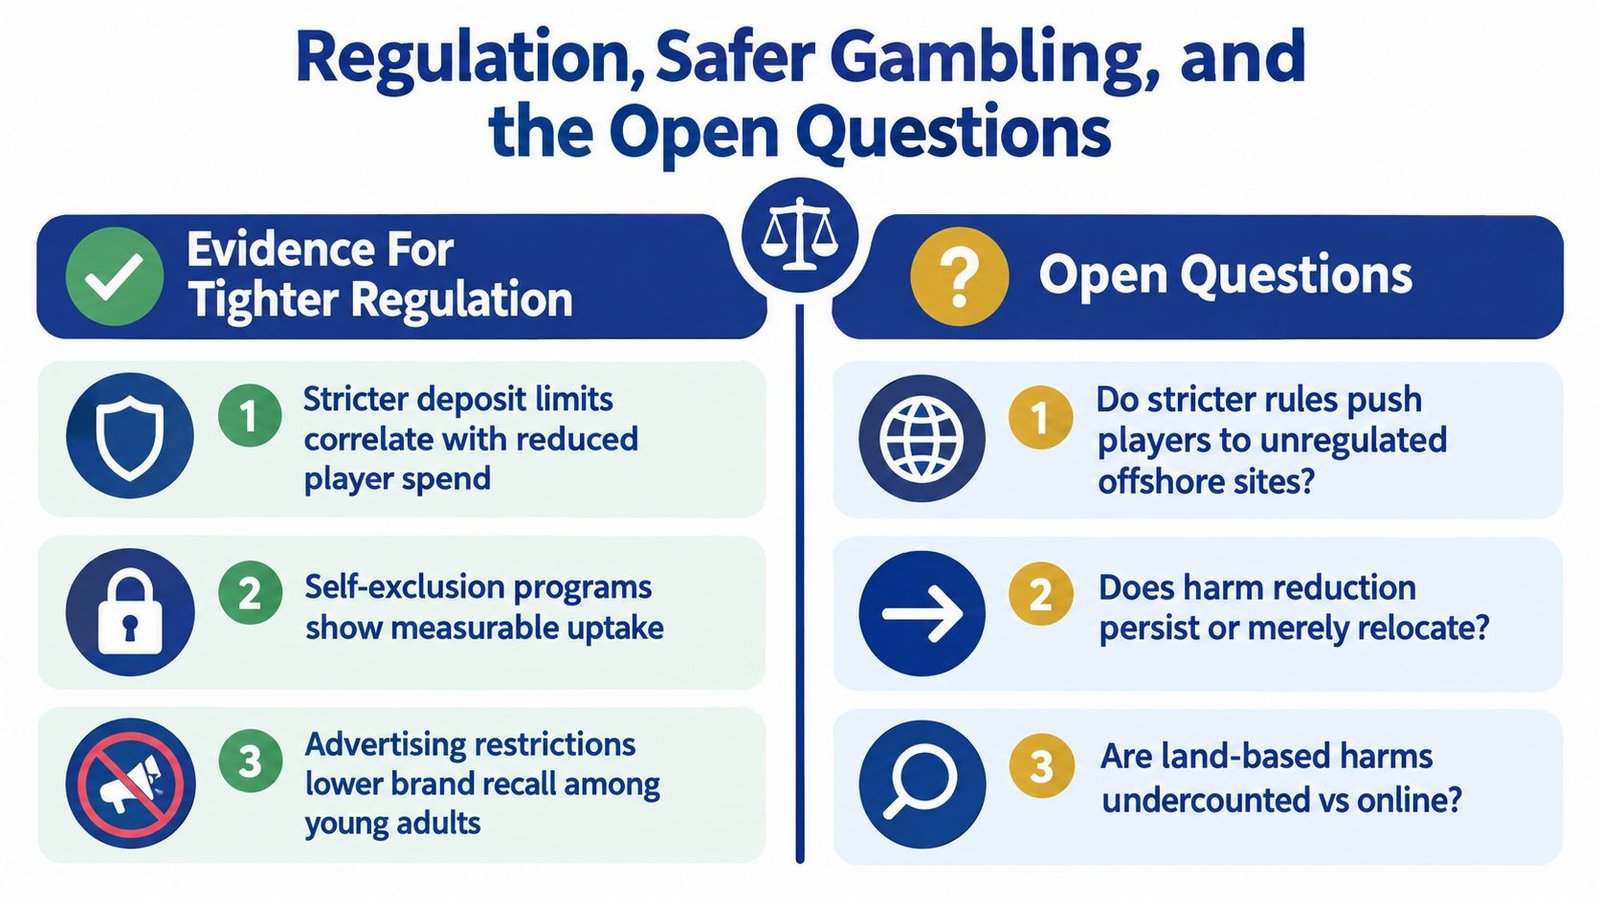
The most important regulation stories in 2026 are about whether product-level controls reduce harm, shift behaviour, or move activity elsewhere.
The UK is using product design, not just messaging
The UK's 2025 slot regulation created two age-based stake limits for online slots, £2 per cycle for players under 25 and £5 for players aged 25 or over (Gambling Act 2005 amendments). That matters because the rule ties account-age data directly to game-level stake controls. For operators, compliance now sits inside the wagering product, not only in marketing or affordability checks.
Other jurisdictions are taking different routes. New Zealand is moving to license online casino gambling with stated aims of harm minimisation, tax collection, and consumer protection (academic review of gambling-harm regulation). New South Wales is using operational controls as well, including card registration that tracks play across activities and time, plus mandatory breaks intended to curb excessive sessions (UK government impact assessment). The Philippines offers a parallel test case, as tracked in our PAGCOR online casino coverage.
The open question is still causation
Evidence quality remains the problem. The UK assessment says 15.4% of people who played fruit or slot machines in person recorded a Problem Gambling Severity Index score of 8 or higher, while 9.2% were moderate risk, but it also says the evidence is inconclusive on whether more gaming machines cause additional harm (UK government impact assessment). That leaves reporters with a thin base for broad claims.
A sharper approach is to ask what each rule is meant to change, then look for the right indicators. If the goal is lower harm, the relevant measures include licensed participation, self-exclusion use, offshore migration, complaint volumes, and enforcement workload. If the goal is a safer product mix, the question is whether play shifts into other channels.
Reporting Gaps Worth Watching Through 2026
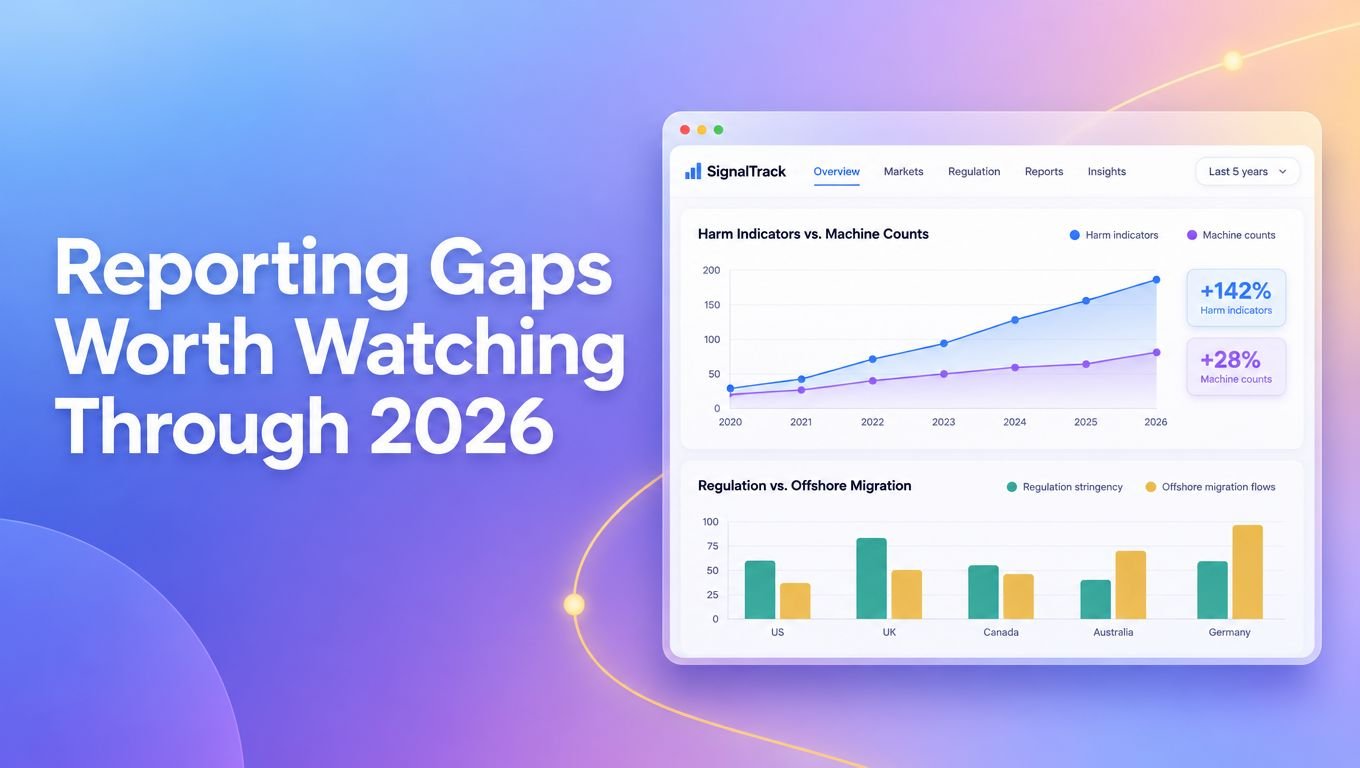
A recurring problem in casino industry news is simple to spot and hard to fix. Coverage often treats machine counts as a proxy for harm, then treats regulation as if it automatically lowers gambling rather than shifting where play happens.
Machine counts are not exposure data
The UK assessment is useful because it avoids that overreach. It says the evidence is inconclusive on whether more gaming machines cause additional harm, even though in-person fruit and slot machine play is associated with higher risk markers. Machine availability, session length, venue type, and local conditions all shape exposure, so a headline about machine numbers alone leaves out most of the story.
A better evidence set would follow player exposure, session duration, product type, and local context over time. Queensland is often cited as a model for that kind of reporting, because it publishes separate figures on electronic gaming machines, player spending, and tax revenue for clubs and casinos (academic review of gambling-harm regulation). That is the level of detail journalists should look for.
Segment mix still explains more than topline growth
Topline revenue can hide the underlying business mix. NagaCorp's 2025 filing shows a clear split between mass-market and VIP revenue, which is enough to show how one operator can depend on two very different customer bases (NagaCorp annual report 2025). That kind of segment math matters more than a single GGR headline.
The same caution applies to online and partner revenue. Boyd's filing shows that reimbursements and related non-core lines can move sharply without meaning the same thing as core gaming demand, so readers should not read every growth line as the same kind of growth (Boyd Gaming 2025 Annual Report and 10-K).
A stronger reporting frame keeps three questions in view: how much play stays in licensed channels, how much shifts offshore, and how a filing separates win, handle, and non-core revenue. Without that split, “regulatory impact” stories often blur substitution with decline, and that can lead to the wrong conclusion.
How to Read Casino Industry News Going Forward
The best way to read a casino headline is to slow it down. Start with the segment, because slot win, table revenue, sportsbook receipts, remote casino GGY, and partner reimbursements do not mean the same thing.
Then check the reporting period and the comparison. A monthly dip can sit inside a positive annual trend, and a year-over-year record can hide weakness in one vertical. The source matters too, because regulator data and operator filings answer different questions.
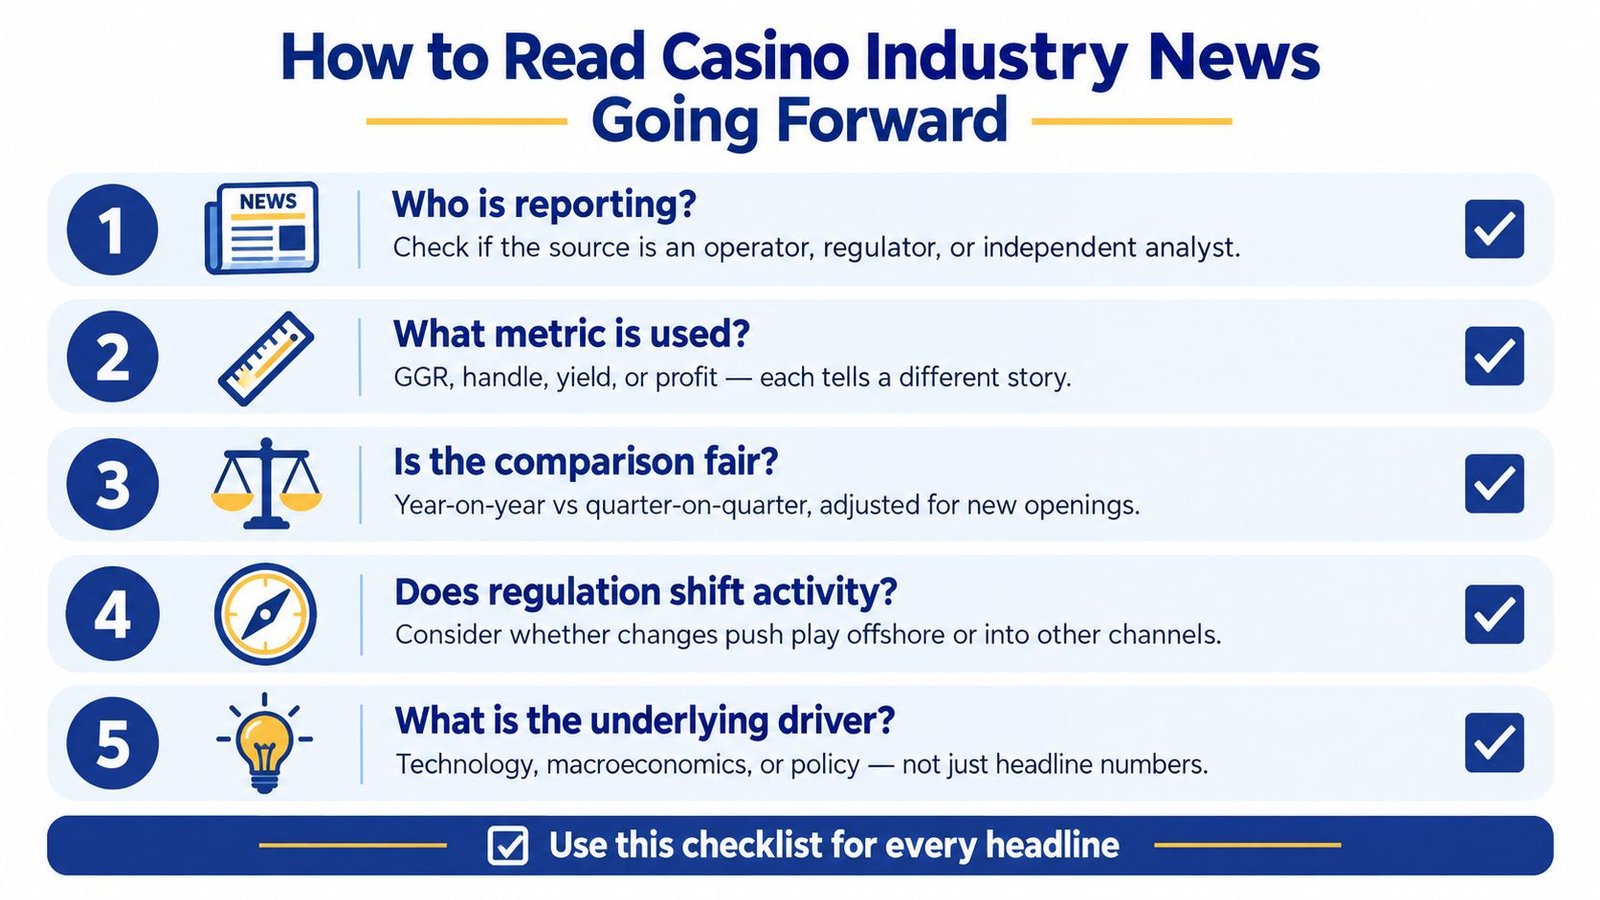
Before accepting any new market claim, ask five things: who reported it, what metric was used, whether the comparison is fair, whether regulation might shift activity rather than reduce it, and what the underlying driver is. That checklist works for Nevada releases, UK quarterly data, licensing updates, and operator filings alike.
The rest of 2026 should keep testing those questions. Watch for more UK remote-casino disclosures, any implementation data from New Zealand's licensing system, and early evidence on how New South Wales' card-based play tracking changes behavior. Top 1 Rank will keep tracking those filings, regulator releases, and segment splits as they land.





Join thousands of gaming professionals receiving the latest iGaming news, regulatory updates, and market insights.
