


U.S. sportsbooks processed $166.94 billion in legally reported wagers in 2025 and generated $16.96 billion in revenue. That gap is the core story in sports betting news, because it shows that record handle no longer tells the full commercial truth.
Sports betting coverage still tends to treat volume as victory. That worked when legalization was still spreading state by state, but it breaks down when the market is large enough for pricing, tax policy, product mix, and consumer behavior to matter more than raw staking totals.
Table of Contents
- Why U.S. Handle Growth No Longer Equals Profit
- Tracing the Structural Shift Since 2018
- Duopoly Dominance and Competitive Alternatives
- The Hidden Consumer Costs of Legalization
- Tax Rates as Market Entry Deciders
- How to Evaluate Sports Betting News Sources
Why U.S. Handle Growth No Longer Equals Profit
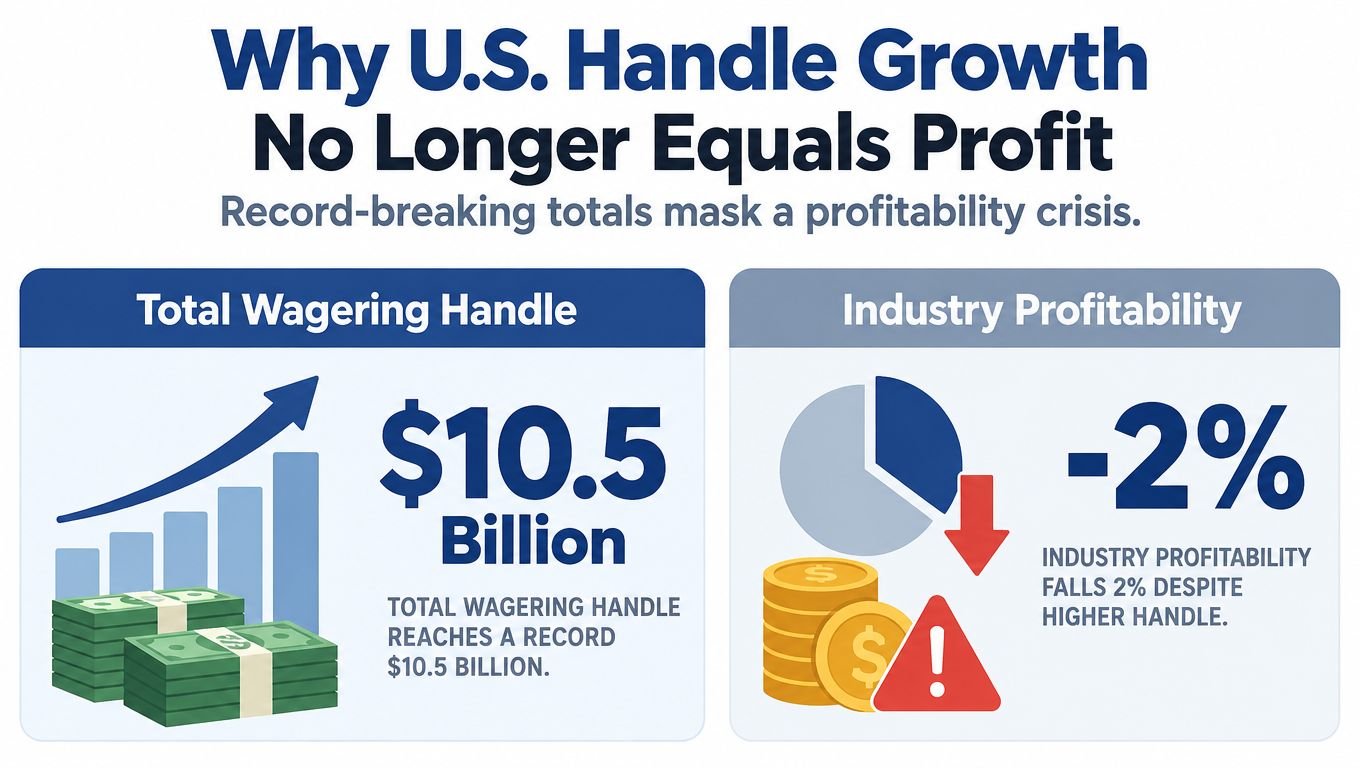
The headline number is impressive, but the operating question is sharper. $166.94 billion in handle produced $16.96 billion in sportsbook revenue in 2025, which implies a national hold of about 10.16%. That makes revenue the cleaner measure of market quality (Track360 market forecast).
Handle is activity, revenue is durability
Handle measures how much bettors staked. Revenue measures what sportsbooks retained after payouts. Those are related, but they do not signal the same business outcome.
Practical rule: A rising handle line can still hide weaker pricing, heavier promotions, or a less favorable bet mix.
That distinction matters because revenue grew 22.8% while handle rose 11.0% in 2025, so the industry captured more value from each dollar wagered than a handle-only headline would suggest. For operators, the message is clear, margin management matters as much as acquisition, and sometimes more.
What the news cycle often misses
Release-driven coverage usually stops at “record-setting” totals. The more useful reading is whether those totals came from better pricing discipline, a healthier product mix, or more efficient promotions. A market can expand on paper while the economics tighten underneath.
Internal benchmarking should start with hold, gross gaming revenue, promotional deductions, and contribution margin by sport and bet type, not with handle alone. When a sportsbook acquires customers cheaply through user acquisition cost analysis but gives too much back through pricing or bonuses, the top line can still look strong while profitability weakens.
The same logic applies to state launches. A new jurisdiction can lift handle, but the key question is whether it produces durable net revenue after tax, platform costs, and promotions. For readers comparing market moves, that is the difference between growth and quality growth.
Tracing the Structural Shift Since 2018
The modern U.S. market starts with the May 14, 2018 Supreme Court ruling in Murphy v. NCAA, which invalidated the federal PASPA restrictions that had effectively confined single-game sports wagering to Nevada. In the partial year after that decision, legally reported handle was about $6.6 billion across seven states, and by 2025 it had reached $166.94 billion (WalnutInvest market statistics).
Legalization changed the market, not just the channel
That jump was not a simple transfer from black-market betting into regulated books. It built a larger commercial system with state launches, platform partnerships, geolocation controls, payment flows, and ongoing regulatory scrutiny. By 2025, sports betting was legal in 38 states plus Washington, D.C., with about 30 jurisdictions allowing online or mobile wagering.
The business effect is broader than raw volume. A larger legal map increases the pool of eligible users, reshapes competitive access, and expands the tax base that state governments can draw from. It also means reporting must stay local, because a rule change in one state can alter operator economics without changing national handle much at all. That is also why state-by-state reporting still matters, and why our PAGCOR regulatory updates for 2026 remain relevant even after the headline market became huge.
Why this history still drives current coverage
The scale shift explains the rhythm of sports betting news today. A new launch can still move investor sentiment, operator strategy, and affiliate positioning because the market is still assembling in some jurisdictions while maturing in others. The result is a patchwork industry where local regulation can create national consequences.
Legalization did not merely reroute existing wagering. It built a regulated market large enough to support national brands, data-driven trading teams, and recurring public reporting.
For market watchers, the practical conclusion is straightforward. Current developments need to be read against the post-2018 reset, not against the old Nevada-only era. Launch dates, market-access rights, and mobile approvals still carry commercial weight, even when the category already supports cumulative wagers on a scale that would have been hard to imagine before 2018.
Duopoly Dominance and Competitive Alternatives
FanDuel and DraftKings held approximately 44% and 34% of operator gross wins, respectively, or about 78% combined, in the U.S. market (Reuters). That level of concentration changes how every partnership announcement, technology rollout, or odds-format update should be read.
Scale compounds faster than promotion
Large operators benefit from first-party behavioral data, deeper trading teams, broader brand awareness, and the budget to defend share in multiple states at once. That makes simple discounting a weak strategy for smaller books, because bigger rivals can often match or outlast generic promotions.
Smaller operators need sharper positioning. Faster in-play markets, tighter local partnerships, niche sports coverage, and more disciplined customer segmentation are more credible paths than trying to outspend the leaders. Circa Sports has used a more targeted approach around regional and lower-profile betting interest, which shows how a focused operator can build relevance without matching national ad budgets.
The concentration also affects suppliers and regulators. Technology vendors must design for enterprise-scale latency, settlement integrity, and risk controls, and a PAGCOR B2B provider application process guide is a useful reference for the level of process discipline that enterprise buyers expect. Policymakers, meanwhile, need to watch whether a concentrated market limits price competition or increases dependence on a few dominant platforms.
Competition is now about structure, not slogans
The most important interpretation of the duopoly is that competition moved up the stack. Books now compete on execution quality, product depth, and retention economics, not just on who offers the loudest sign-up promotion.
Operational insight: In a concentrated market, the best indicator of resilience is often not user growth, but whether a bookmaker can defend margin while still acquiring customers.
That framing matters for sports betting news because a partnership headline can signal very different things depending on who announced it. For a national leader, it may reinforce scale. For a smaller operator, it may be a survival move. Readers who track the market closely should always ask which side of that equation a deal serves.
The Hidden Consumer Costs of Legalization
Handle and tax receipts miss the household side of sports betting. Stanford's summarized research fills that gap, showing that bettors expected to break even but lost about 7.5 cents per dollar wagered and that online sports betting reduced credit scores by an average of 12 points (Stanford research summary).
Losses are not distributed evenly
Parlays matter because bettors often underestimate how hard they are to win. The core issue is misjudgment, not just loss. That makes consumer harm a product-design problem, and it belongs in the same analysis as how to avoid phishing scams, because consumer strain can reshape policy scrutiny as quickly as any revenue report.
The same Stanford summary reports that online sports betting increased bankruptcy by approximately one case per 10,000 at-risk adults per quarter. Minnesota Senate committee testimony separately described model-based estimates of roughly 30,000 additional annual bankruptcies and $8 billion in additional annual debt collections, which should be read as scenario estimates rather than official counts.
What serious coverage should track
That evidence changes the standard for sports betting news. Tax receipts matter, but they do not replace household-level outcomes. Reporting should follow savings behavior, credit delinquency, bankruptcy, and debt collection after launches instead of treating state revenue as the full scorecard.
The industry can grow while some consumers come under pressure. Those are different readings of the same market.
For operators and regulators, responsible-gambling monitoring should sit alongside market analysis. It belongs with acquisition spend, hold, and retention, because consumer strain can alter policy scrutiny just as quickly as any revenue report.
Tax Rates as Market Entry Deciders
State tax policy now functions as a competitive filter, and the spread in outcomes is visible in state receipts. The U.S. Census Bureau reported that state sales-tax revenue from sports betting increased 382%, from $190 million in Q3 2021 to $917 million in Q2 2025. It also shows how wide the pricing gap can be, with tax rates ranging from 6.75% in Iowa and Nevada to 51% in New Hampshire, New York, and Rhode Island (U.S. Census Bureau).
Different tax structures create different market behaviors
New York shows what happens when a state pairs a large online market with a very high take. Its online market launched on January 8, 2022, applies a 51% tax on gross gaming revenue, and regularly produces more than $200 million in quarterly state revenue. That combination signals that scale can offset a heavy tax load, but only for operators that can keep enough margin after payouts, promotions, and compliance costs.
Illinois points in the other direction. The state shifted on January 1, 2025 from a flat 15% tax on adjusted gaming revenue to a graduated rate of 20% to 40% (U.S. Census Bureau). The structural change suggests states do not set tax terms once and leave them untouched, they recalibrate after launch when market response or revenue goals change.
Those choices are operational, not cosmetic. Tax design shapes bonus depth, marketing intensity, entry timing, and whether licensed books can preserve enough margin to compete with offshore alternatives. In higher-tax states, operators have less room to absorb customer acquisition costs or sustain aggressive promotions.
Why investors care about tax fragmentation
A wide tax spread changes the risk profile of expansion. Lower-tax states can support longer customer-payback periods and more flexible pricing. High-tax states can still work, but usually only for operators with enough scale, brand strength, or product efficiency to survive thinner margin.
For readers following sports betting news, the question is whether a legal market is economically workable for a given operating model. Tax policy belongs in the same analysis as market access, product design, and retention economics, because it shapes which operators can stay in the market and which ones cannot.
How to Evaluate Sports Betting News Sources
A sports betting headline can look precise while saying very little. The first check is source quality. First-party reporting, a regulator's filing, a public company disclosure, and a promotional release do not carry the same evidentiary weight, so readers should ask what kind of document is driving the claim. Handle alone rarely explains the business result.
Start with the right metric
Handle, gross win, and revenue are not interchangeable. Handle shows activity. Gross win shows stakes minus payouts. Revenue shows what the operator keeps after settlement. If a story does not define the metric, it becomes easy to overread performance or compare figures that measure different things.
H.R. 2087 is a useful example of why regulatory detail matters. The proposal defines a sports wager, calls for location-verification controls and internal-control systems, and includes operational restrictions such as limiting deposits to five per 24-hour period (H.R. 2087 text). That level of detail matters because it changes compliance cost, payments handling, and product design in ways a market-growth headline cannot capture.
A practical source checklist
- Regulatory filings first: State commissions, census releases, and federal legislative text usually show market structure most clearly. A filing that names tax treatment, license counts, or control requirements is doing real work.
- Company disclosures next: Public operators often reveal margin pressure, promotional intensity, and product performance more clearly than press releases do. A disclosure that names promotional deductions as a share of gross win is more useful than one that cites handle only.
- Treat PR carefully: Announcements can be useful, but they are not neutral evidence. See our overview of gambling advertising rules for why promotional language needs a second read.
- Look for metric definitions: A story that uses handle, revenue, or gross win without definitions leaves the reader guessing about the denominator and the business meaning.
- Read for policy consequences: Tax rates, geolocation rules, deposit limits, and credit-card restrictions are operating constraints, not side notes.
The best sports betting news story explains who gains margin, who loses margin, and which rule or product change caused the shift.
That standard separates market intelligence from hype. It gives operators, investors, and regulators a clearer view of where the business is headed.





Join thousands of gaming professionals receiving the latest iGaming news, regulatory updates, and market insights.
